Reports in Workflows & Dashboards
Last updated 25 May 2026
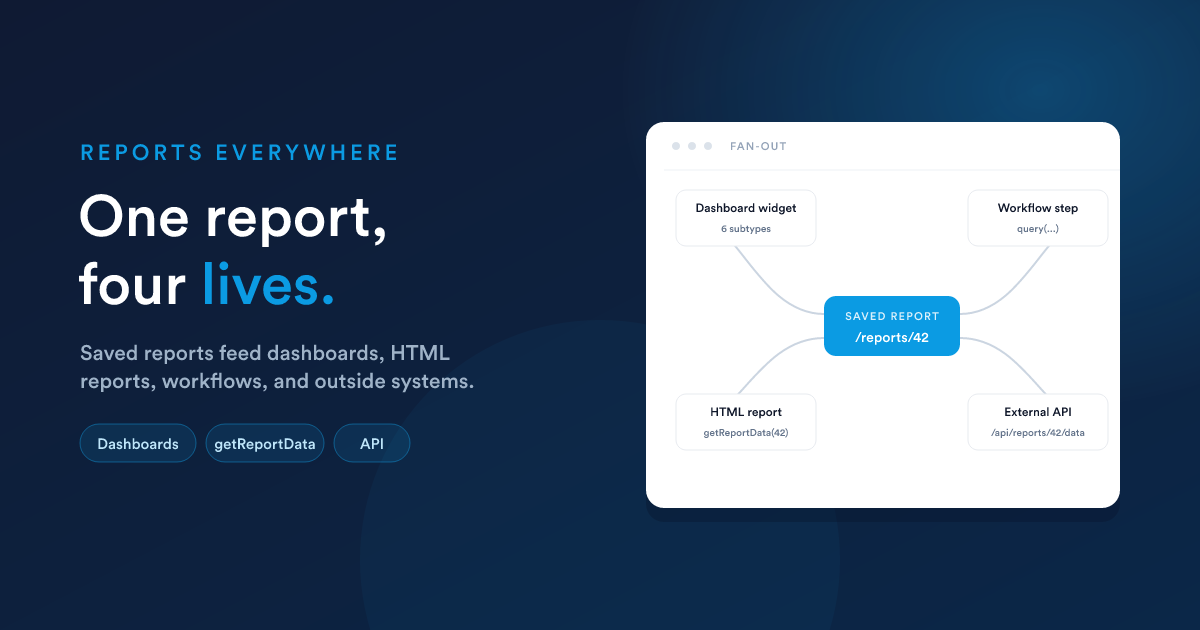
A saved report is not only viewed on its own page. It is also a data source for dashboards, for HTML reports, for workflow steps, and (via the API) for outside systems.
A report as a dashboard widget
The most common second life for a saved report is becoming a widget on a dashboard. Every published report automatically becomes available as a widget type. You don't have to do anything special. Add a widget to a dashboard, pick the report, and choose how it should render.
A report widget can be displayed in any of six ways:
- Single value: pull one cell from one column for a big-number tile.
- Single number: alias for Single value.
- Line chart: plot two columns as X and Y.
- Bar chart: plot two columns as category and value.
- Pie chart: plot two columns as label and slice value.
- Grid: the report's full result as a small table inside the widget.
The full configuration (axes, label or value columns, single-value column, optional limit) is covered in Report widgets.
What kinds of reports work as widgets
- Data Grid reports work as Grid, Line, Bar, Pie, or Single value widgets. The report's query is the data source; the widget configures how it is rendered.
- HTML reports work as custom HTML widgets. The whole rendered template appears as the widget contents. See Custom HTML widgets. This is the "any imaginable widget" route.
Pulling a report's data from a Flexie Scripting context
If you want to use a report's data inside something else (an HTML report that combines multiple reports, an email template, an automation step) you can call the saved report's data with the getReportData(...) function.
The exact availability of
getReportData(...)depends on which Flexie Scripting context you are in. It is available inside HTML reports and the report-render path. If you call it from a general workflow action and find it isn't recognised, fall back to writing the equivalentquery("SELECT ...")in your script;query(...)works everywhere Flexie Scripting runs.
Signature
getReportData(reportId, userId?, filters?, templateData?)
| Argument | Meaning |
|---|---|
reportId |
The numeric id of a saved report. |
userId |
Optional. If provided, the report's placeholder variables ({user_id}, {group_id}, {role_id}, {timezone}) are resolved against that user rather than the signed-in user. |
filters |
Optional. An array of { alias, operator, value } objects, programmatic equivalents of what a user would fill into the report's filter row. |
templateData |
Optional. Extra Flexie Scripting tokens you want resolved inside the report's query before it runs. |
The function returns an array of rows, the same shape as the data grid would show; each row is a key-value map of column names to values. Capped at 1,000 rows, same as everything else.
Using it inside an HTML report
The simplest pattern, re-use an existing aggregated report as a data feed:
{% set rows = getReportData(42) %}

<table>
  <tr><th>Owner</th><th>Total won</th></tr>
  {% for r in rows %}
    <tr><td>{{ r.owner_name }}</td><td>{{ r.total | number_format(0) }}</td></tr>
  {% endfor %}
</table>
…assuming report 42 is a saved data grid report whose query produces owner_name and total columns.
Applying filters programmatically
{% set rows = getReportData(
    42,
    user_id,
    [
      { "alias": "status",  "operator": "eq", "value": "finalized" },
      { "alias": "country", "operator": "eq", "value": "DE" }
    ]
) %}
The filter aliases are the same as those defined in the saved report's filters JSON.
Workflows reading a saved report
Workflows reach reports two ways.
Inside a workflow action's Flexie Scripting fields
Any step's value, template, or condition fields are Flexie Scripting. You can pull report data there with query(...) and act on it.
{# Compute today's pipeline value for the contact's owner #}
{% set rows = query("
  SELECT SUM(amount) AS total
  FROM deals
  WHERE owner_id = " ~ owner_id ~ "
    AND is_won = 0 AND is_lost = 0
") %}

{% set pipelineValue = rows[0].total | default(0) %}
This isn't strictly using a saved report; it is running an ad-hoc query. But the same access functions are available.
Calling the API from a webhook
A workflow's Webhook action can call your own back-end, which in turn hits /api/reports/{id}/data. Useful if the report does something complex you don't want to recompute inline.
Reports as a feed for other systems
Outside systems can read a report through the API:
GET /api/reports/{id}/datareturns the report's rows.- Pass filter values as query parameters to apply them.
- The 1,000-row cap and the read-only restrictions still apply.
Use this when another team or a partner needs a snapshot of your data: they authenticate with a Flexie API token, pull the report's rows, and load them into their own system.
Patterns that come up a lot
A KPI feed for an external dashboard
- Build a small data grid report: one row, a handful of columns.
SELECT (count_query) AS deals, (sum_query) AS pipeline, .... - Mark the report as published and give it a stable id.
- Have the external dashboard call
/api/reports/{id}/dataon its refresh cycle.
A bigger report feeding multiple smaller widgets
- Build one data grid report that produces all the columns you would ever need (for example
owner_id, owner_name, won_count, won_total, open_count). - Add it to a dashboard as five different widgets: Single value for each metric, Bar chart for the ranking.
- Every widget shares one query, one data source, one update. Fast and consistent.
An HTML report that combines multiple sources
- Build an HTML report that calls
query(...)(orgetReportData(...)) multiple times for the different sections of a single page. - Render the results as your own custom layout: KPI cards across the top, tables in the middle, a chart at the bottom.
- Drop that HTML report on a dashboard as a custom HTML widget. See Custom HTML widgets.
Next steps
- Dashboards: where reports usually end up.
- Dashboards: report widgets: the six visualisation subtypes in detail.
- Dashboards: custom HTML widgets: using an HTML report as a fully custom widget.