Overview
Last updated 25 May 2026
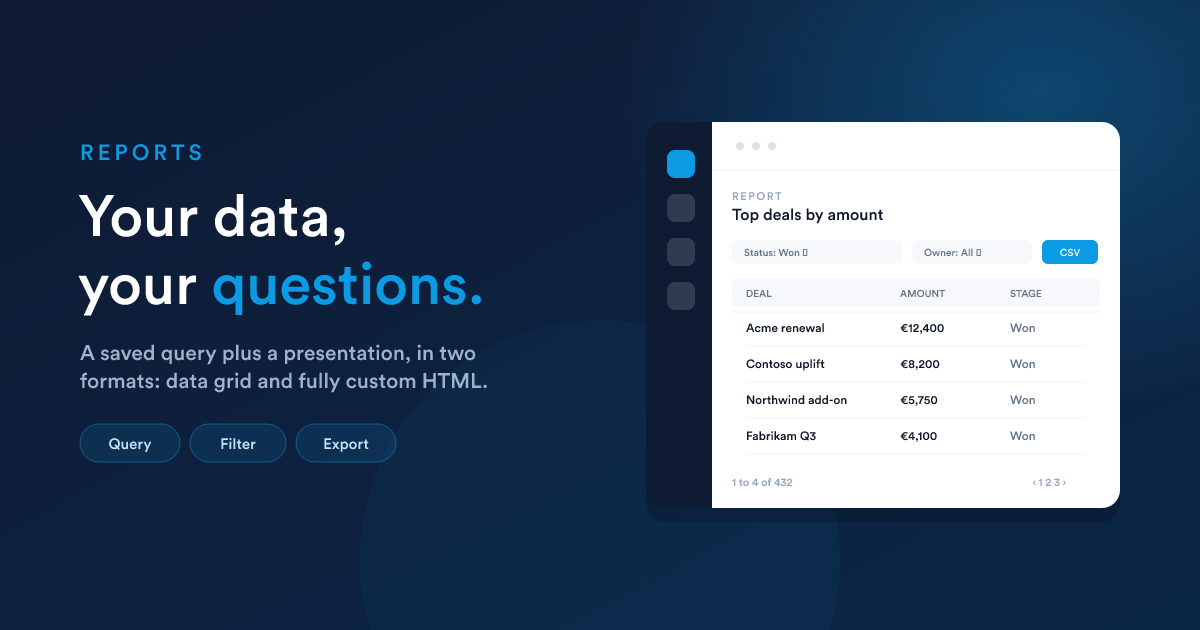
A report in Flexie is a saved query plus a presentation. When someone opens it, Flexie runs the query, applies any user-supplied filters, and shows the result in one of two forms: a data grid (a sortable, filterable, exportable table) or a fully custom HTML page you wrote yourself.
What a report turns into
A single report can be used as:
- An operational list ("all deals closing this month")
- An aggregate number ("revenue per salesperson, last 90 days")
- A cross-record summary ("top accounts by case volume")
- A bespoke dashboards-in-a-page (an HTML report can do anything HTML can do)
- A data source for dashboard widgets
- A data source for scripts and workflows
There is no separate BI tool to learn; reports live alongside everything else.
The two output formats
When you create a report you pick one of two output formats. This is the central decision and changes both what you write and what the report can do.
| Output format | What you write | What gets rendered | When to use it |
|---|---|---|---|
| Data Grid (default) | A SELECT query |
A sortable, filterable, paginated table | Lists, exports, anything tabular |
| HTML | HTML + CSS + JavaScript with Flexie Scripting | Whatever you wrote, rendered as a page | Fully custom layouts: cards, dashboards, kanban boards, anything you can build with web technology |
You can mix and match in your account: some reports are grids, others are fully bespoke HTML pages. They are stored in the same table and listed together.
The output format is fixed for the life of the report. Once a report exists as a grid you can't flip it to HTML; create a new report if you need to switch.
What every report has
Whether it is a grid or HTML, every report has:
- Name, description, category, for finding it later.
- Output format,
Data GridorHTML. - The body, your query (for grid) or your template (for HTML).
- Filters, optional user-input controls shown above the report when someone opens it. See Report filters (in depth).
- Default sort, which column to order by, ascending or descending.
- Access list, who can see it. Combinations of "all users", specific permissions, groups, or individual users.
- Owner, the user who created it (relevant for permission checks).
The lifecycle of a report
- Create at
/reports/new, writing a query or HTML template. - Open at
/reports/view/{id}. Sort, filter, paginate, export to CSV. - Refine the filters, sort, and columns and save.
- Reuse as a dashboard widget, or query it from a script.
The data refreshes on every open, so there is no stale-cache surprise. Heavy queries are protected by a hard 1,000-row cap (see Restrictions).
What is in this section
- Data Grid reports: writing the
SELECT, the placeholder variables Flexie injects for you ({user_id},{group_id},{role_id},{timezone}), the{filters}substitution, what queries are allowed and what is blocked, default sorting, and column ordering at view time. - HTML reports: building a fully custom report from HTML + CSS + JavaScript with Flexie Scripting; using the full Flexie Scripting toolkit inside the template; calling multiple data lookups and weaving the results together; the security model.
- Viewing, exporting & access: the view page, sorting and pagination, CSV export, and the "Who can access this report?" permission model.
- Reports in workflows and dashboards: using a saved report as a dashboard widget (with six visualisation subtypes), pulling its data from a Flexie Scripting context, and the
getReportData(...)accessor. - Report filters (in depth): user-input filters above the grid. The JSON shape, the six filter types and their operators, the three substitution modes (
{filters}placeholder, automatic, andmanual), and, uniquely, using Flexie Scripting inside the filter JSON to build dynamic option lists, conditional filters, and date-aware labels.
Closely related
- Dashboards: collections of widgets, where most reports end up being displayed.
- Flexie Scripting: the language you use inside HTML reports.
- Workflows: workflows can pull values from saved reports.