Overview
Last updated 25 May 2026
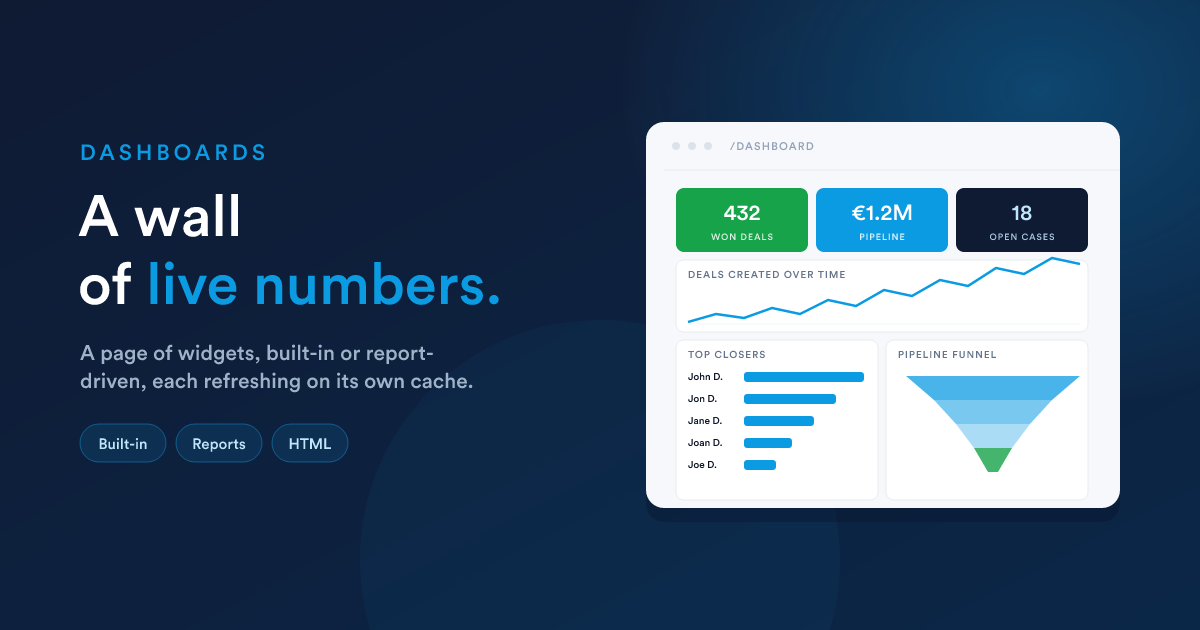
A dashboard in Flexie is a page made of widgets. Each widget is a small, self-contained visualisation, a count, a chart, a list, a fully custom HTML block, and a dashboard is just a layout of these widgets on a screen.
The shape of a dashboard
You can build several dashboards (one per team, one per role, one per topic), choose a default one, share dashboards across the company or with selected groups, and publish a dashboard publicly behind a signed link if you need to.
The two kinds of widget
Every widget on a dashboard is one of these:
| Kind | Where its data comes from | Examples |
|---|---|---|
| Built-in widget | A specific feature inside Flexie | "Deals created over time", "Pipeline funnel", "Email open rate", "Top closing users" |
| Report-driven widget | A saved Report, data grid or HTML | A bespoke metric you built yourself, a custom layout, a single-value KPI from one of your queries |
Both kinds use the same widget model: they are configured the same way, you size and position them the same way, they refresh the same way. The difference is just where the numbers come from.
Because HTML reports can run any HTML, CSS, and JavaScript with Flexie Scripting, and any HTML report can be placed on a dashboard as a widget, you can build any widget you can imagine, well beyond the catalogue of built-ins. This is documented in detail on Custom HTML widgets.
Built-in widget catalogue (preview)
Flexie ships widgets for the parts of the product you would expect, including:
- Deals: deals created over time, won and lost ratios, top closers, deal forecast, top stages, the pipeline funnel.
- Email: sent, read, clicked, unsubscribed over time, summary pies.
- Page tracking: page hits, A/B test outcomes.
- Workflows: processing time, recent activity.
- Cases: case volume, statuses.
- Attachments: download stats.
The complete catalogue with every widget type is in Built-in widgets.
Chart types
Widgets that show charts use one of these visualisations:
| Chart | Used for |
|---|---|
| Line | A value over time, possibly with multiple series |
| Bar | Comparing categories, top N rankings, period-over-period |
| Pie | Composition, share of a whole |
| Funnel | Stage-by-stage progression, most often a pipeline |
All charts are rendered in the browser and redraw responsively when their container resizes. There is nothing to install on your side.
Layout, sizing, refresh
- Widget width is one of
25%,50%,75%, or100%of the dashboard width. - Widget height is a fixed pixel value (a small set of preset heights) or Auto, which lets the widget grow with its content.
- Widgets are ordered with a numeric position, lowest first, and flow left-to-right within their row.
- Each widget has its own cache lifetime (in minutes). When a viewer opens the dashboard, fresh widgets render from cache; expired ones recompute. Default cache is two hours; for live KPIs you can set it lower.
- You can manually refresh the whole dashboard.
The detailed sizing, layout, and refresh rules are on Layout & sharing.
Access and sharing
A dashboard has the same Who can access this dashboard? field a report does. You combine All Users, specific roles, user groups, or individual users in one list. A user matching at least one entry can see the dashboard.
In addition, a dashboard can be shared publicly via a signed link (/d/{hash}), useful for sending a snapshot to a partner or an external stakeholder without giving them a Flexie account. The link can be set to expire on a date.
Details on Layout & sharing.
What is in this section
- Built-in widgets: the complete catalogue, organised by area, with the chart type and configuration of each.
- Report widgets: using a saved data grid report as a widget; the six visualisation subtypes (single value, single number, line, bar, pie, grid) with their settings.
- Custom HTML widgets: using an HTML report as a widget; the "any imaginable widget" route, with worked examples.
- Layout & sharing: sizing, ordering, the cache, multiple dashboards, access control, and public sharing.
Closely related
- Reports: where most non-built-in widgets get their data.
- Flexie Scripting: the language HTML widgets use.