Custom HTML Widgets
Last updated 25 May 2026
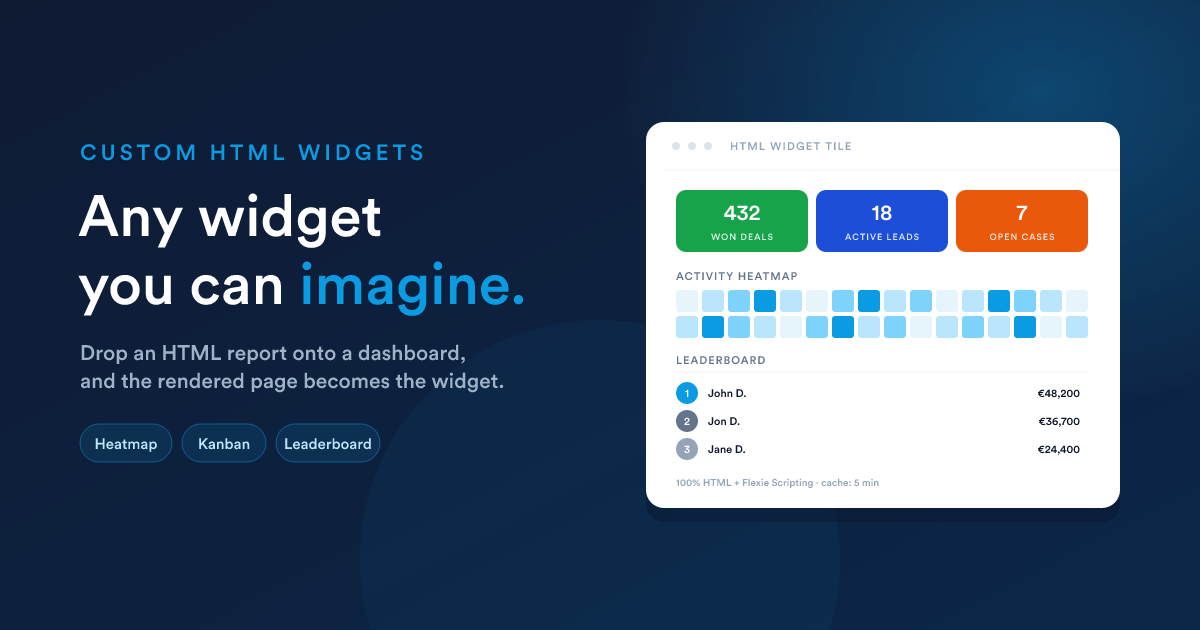
When the built-in widgets and the six Report visualisations aren't enough, drop in an HTML report as a widget. Because the HTML report can do anything HTML can do, combined with the full Flexie Scripting toolkit, you can build any widget you can imagine.
How it works
- You create an HTML report (Reports → New → Output format = HTML) with a template that produces exactly the layout you want: KPI cards, custom charts, multi-section grids, anything.
- Once that report is published, it appears in the dashboard's "Add widget" menu under Reports, just like a data grid report, but with a distinct subtype: HTML.
- When you add it as a widget, no further visualisation choices are needed (no axes, no value columns). The whole rendered template is the widget.
The widget renders its HTML inside its tile on the dashboard. Inside that tile, anything goes: your styles, your JavaScript, your custom mini-charts.
Why this matters
The dashboard's built-in chart engine renders line, bar, pie, and funnel. That is already a lot. But if you want:
- Three KPIs in one tile. Sales, leads, NPS, side by side, each with its own colour and trend arrow.
- A heatmap, a treemap, a Sankey, anything outside line/bar/pie/funnel.
- A custom layout, a table on the left, a chart on the right, captions underneath.
- A "kanban-as-a-widget", columns drawn from your data.
- A live status board, colour-coded cards with conditional formatting.
- Embedded media, a PDF preview, a video, an image gallery driven by your data.
…none of those fit a pre-defined visualisation type. With an HTML widget, the visualisation is whatever you write, including pulling in third-party chart libraries via a <script src="…">.
A worked example, a three-up KPI tile
A single widget showing three KPIs side-by-side, each with its own colour and a small caption.
Step 1, create the HTML report
Reports → New → Output format = HTML. Paste this into the template field:
<style>
  .kpi-row { display: grid; grid-template-columns: repeat(3, 1fr); gap: 1rem; }
  .kpi     { padding: 1rem; border-radius: 8px; color: #fff; text-align: center; }
  .kpi.green  { background: #16a34a; }
  .kpi.blue   { background: #1d4ed8; }
  .kpi.orange { background: #ea580c; }
  .kpi-num  { font-size: 2rem; font-weight: 700; line-height: 1; }
  .kpi-lbl  { font-size: .75rem; opacity: .9; margin-top: .35rem;
              text-transform: uppercase; letter-spacing: .04em; }
</style>

<div class="kpi-row">
  <div class="kpi green">
    <div class="kpi-num">{{ findCount("deal", "is_won", 1) }}</div>
    <div class="kpi-lbl">Won deals (all-time)</div>
  </div>
  <div class="kpi blue">
    <div class="kpi-num">{{ findCount("lead", "is_published", 1) }}</div>
    <div class="kpi-lbl">Active leads</div>
  </div>
  <div class="kpi orange">
    <div class="kpi-num">{{ findCount("case", "status", "open") }}</div>
    <div class="kpi-lbl">Open cases</div>
  </div>
</div>
Name it "Quick KPIs", save, publish.
Step 2, add it as a widget
Dashboard → Add widget → category Reports → pick Quick KPIs. Set the widget size to e.g. 50% × 215px. Save.
The dashboard now has a three-up KPI tile that pulls live counts whenever it refreshes.
What you can use inside
Everything Flexie Scripting offers is available, see HTML reports: what the template can use for the full list. The most useful for widgets:
findCount(...)/findSum(...), straight-to-the-database aggregates, best for "big number" tiles.query("SELECT ..."), when you need a small list of rows for a custom layout.getDealStats,getInvoiceStats,getCaseStats, bundles of figures for an entity, returned in one call.now(),date(...),dateAdd(...), labelling and "last-X-days" windows.formatCurrency,numberFormat,truncate, presentable values.qrCode, embed a live, data-driven QR code into a widget.
For a list of records to render as your own custom layout:
{% set hot = query("
  SELECT name, amount, stage_id
  FROM   deals
  WHERE  is_won = 0 AND is_lost = 0
  ORDER  BY amount DESC
  LIMIT  5
") %}

<h3>Hot deals</h3>
<ul style='margin: 0; padding-left: 1.2rem;'>
  {% for d in hot %}
    <li>{{ d.name }} — {{ d.amount | number_format(0) }}</li>
  {% endfor %}
</ul>
Adding a custom chart
You can pull in any JavaScript charting library by <script src> and feed it data straight from a query(...):
<div id="chart" style="height: 220px;"></div>
<script src="https://cdn.example.com/some-chart-lib.min.js"></script>
<script>
  const data = {{ query("
    SELECT month, sales
    FROM   monthly_sales
    WHERE  year = 2026
    ORDER  BY month
  ") | json_encode | raw }};

  new SomeChartLib(document.getElementById('chart'), {
    type: 'heatmap',
    data
  });
</script>
| json_encode | raw is the safe way to embed a server-computed value inside a <script> block. It produces a properly-escaped JSON literal that can't break the JavaScript on quotes, newlines, or non-printable characters. See the note on Security.
Sizing and refresh
Custom HTML widgets follow the same sizing model as any other widget: pick a width (25 / 50 / 75 / 100%) and a height (a preset pixel value, or Auto to grow with the content). Use Auto when your HTML's natural height is unpredictable; pick a fixed height when you want the tile to slot into a row with the same height as its neighbours.
The same cache lifetime mechanism applies. Set it lower for KPI tiles that need to feel live, higher for monthly summaries.
When not to use an HTML widget
- For one of the built-in visualisations: line, bar, pie, funnel done with a Report widget is far simpler than rebuilding it in HTML.
- When the same simple metric is already a built-in widget: use the built-in. HTML widgets cost more to maintain.
- For very large data sets: the 1,000-row cap still applies to
query(...)and friends inside the template. Aggregate before rendering.
Security & maintenance
Treat HTML widgets like code:
- Restrict who can edit them. A user with the Edit permission on reports can put arbitrary JavaScript in a tile every other viewer runs.
- Always
| json_encode | rawanything you put inside<script>. - Always escape anything you put into
hreforsrcwithurl_encode. - Don't paste opaque third-party snippets you don't understand.
See HTML reports: Security for the longer treatment.
Next steps
- Layout & sharing: sizing, ordering, caching, public sharing.
- Reports: HTML reports: the data source side of this picture.