Built-In Widgets
Last updated 25 May 2026
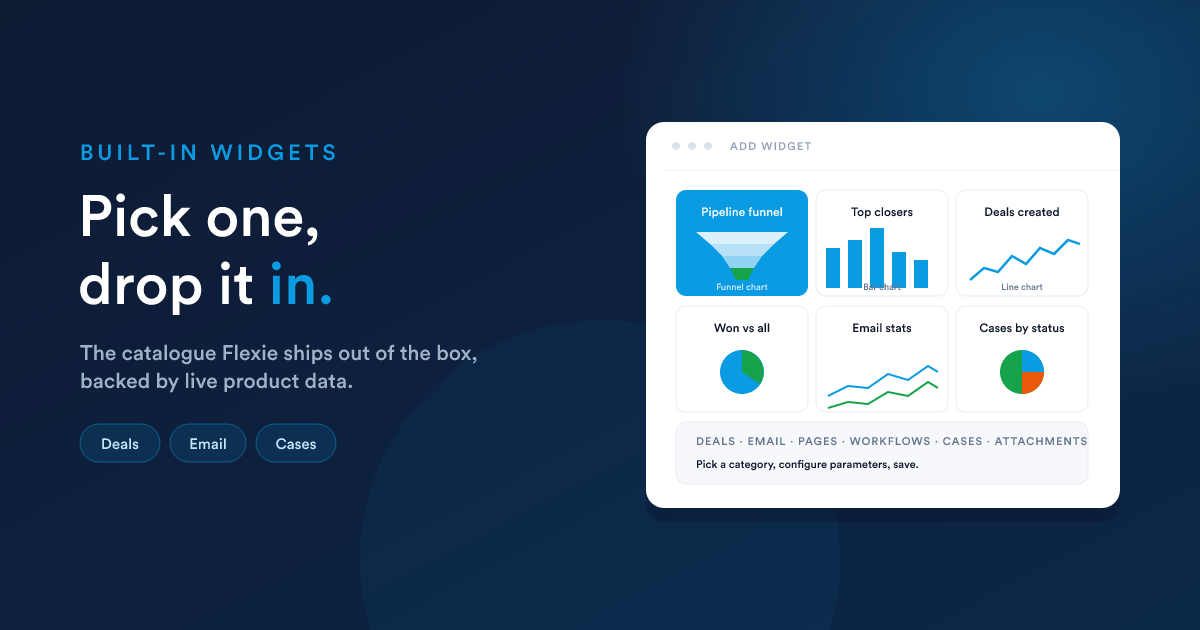
Built-in widgets are listed in the Add Widget dialog, grouped by area. Pick one, set its parameters (time range, pipeline), choose a size, and save.
The catalogue at a glance
Deals
These widgets are wired into the Deals & Pipelines data.
| Widget | Visualisation | What it shows | Main parameters |
|---|---|---|---|
| Deals created | Line chart | Number of deals created over time, multi-series capable | Time range |
| Deal forecast values | Line chart | Forecasted deal value over time | Time range |
| Won vs all | Pie chart | Ratio of won deals to all deals | — |
| Lost vs all | Pie chart | Ratio of lost deals to all deals | — |
| Top closing users | Bar chart | Users ranked by closed-won deals | Time range, top-N limit |
| Top delayed users | Bar chart | Users ranked by deals that have lingered the longest | Top-N limit |
| Top stages | Bar chart | Deal stages ranked by deal count | — |
| Pipeline funnel | Funnel chart | The full pipeline funnel with stages from open through to won and lost | Pipeline (which one to show) |
The Pipeline funnel is the flagship widget: five layered stages stacked like a funnel, with the won path coloured green and the lost path red.
Time range parameter
For widgets that have a time range, you pick a window such as "last 7 days", "last 30 days", "this month", "this quarter". The widget re-computes whenever it is refreshed.
Wired into the Inbox email tracking signals.
| Widget | Visualisation | What it shows |
|---|---|---|
| Email stats over time | Line chart | Sends, reads, clicks (multi-series) over a chosen window |
| Read vs unread | Pie chart | Composition of email outcomes |
| Click vs no-click | Pie chart | Composition of click engagement |
Page tracking
Wired into the page-tracking signal documented under workflow listeners.
| Widget | Visualisation | What it shows |
|---|---|---|
| Page hits over time | Line chart | Hits to tracked pages |
| A/B test results | Pie chart | Distribution between variants in a running test |
Workflows
| Widget | Visualisation | What it shows |
|---|---|---|
| Workflow processing time | Line chart | How long the runtime is taking to process workflow events over time |
| Recent workflow activity | Line chart | Steps executed over time |
Cases
| Widget | Visualisation | What it shows |
|---|---|---|
| Case volume over time | Line chart | Cases created (and optionally resolved) over a window |
| Cases by status | Pie chart | Open, pending, solved, closed |
Attachments
| Widget | Visualisation | What it shows |
|---|---|---|
| Asset downloads over time | Line chart | Tracked attachment downloads |
Choosing a widget
The catalogue above is the menu. For everything else, a metric that isn't on the list, a layout the built-ins don't offer, a chart you want styled a specific way, use either:
- A Report widget: build a saved data grid report and render it as Single value, Line, Bar, Pie, or Grid.
- A Custom HTML widget: build a saved HTML report and drop the whole rendered page into the dashboard.
The point is that you are never blocked by the built-in catalogue: the report-driven widgets cover every dashboard need that has well-defined data, and HTML widgets cover every need that doesn't.
Common parameters
A few parameters appear on many widgets:
- Time range: "last 7 days", "last 30 days", "this week", "this month", "this quarter", "this year". Always evaluated in your account's timezone.
- Top-N limit: for example "Top 10 closers". Default is usually 10; larger values may need a bigger widget size to render legibly.
- Pipeline: for deal widgets, which pipeline to use. If you only have one, this is implicit.
What you can't change
- The visualisation of a built-in widget is fixed. "Top closing users" is always a bar chart; you can't switch it to pie. If you need the same data drawn a different way, build a report-driven widget instead.
- The underlying query is fixed too. Built-ins are part of the product. If you need the metric calculated differently (different time-window definition, different exclusion rule), build a report and use a report widget.
Next steps
- Report widgets: turn a saved data grid report into a widget.
- Custom HTML widgets: turn an HTML report into a widget that can show anything.