HTML Reports
Last updated 25 May 2026
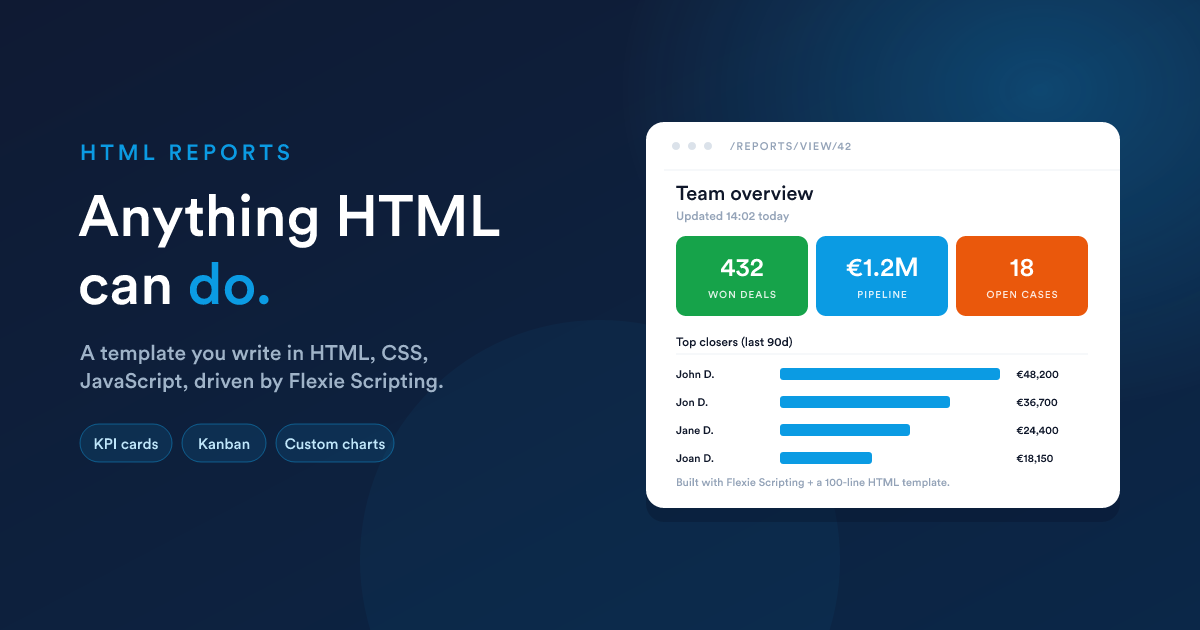
When you choose HTML as the output format, the report's body is not a SQL query. It is a template you write yourself, in HTML, with CSS for styling, JavaScript for interactivity, and Flexie Scripting tokens to pull and shape live data. Whatever you write is what the report shows.
Start at Reports (/reports), click New, set output format to HTML.
When to use it
HTML reports are the right tool for anything the data grid can't present:
- A dashboard-in-a-page with KPI cards, tabbed sections, conditional formatting.
- A kanban-style board rendered from a list of records.
- A printable document (statement, summary, profile) styled exactly the way you want.
- A mini-app that calls the saved data lookups, formats the results, and draws its own visuals.
Combined with dashboard widgets, HTML reports make almost any widget you can imagine possible: drop the HTML report in as a widget and the dashboard renders your custom layout.
The report settings
Same as for Data Grid reports, except:
- Output format is set to HTML.
- Query is replaced by Template, the HTML body of the report. There is no row cap on the template field itself; rendering speed depends on the data lookups inside it (which are capped, see below).
- Filters can still be defined, but how they are applied is up to you (you read the submitted filter values inside your template).
- Default order column and direction do not apply to HTML reports.
What you can write
Anything that renders in a browser:
- HTML for structure.
- CSS for styling, inline, in a
<style>tag, or referenced. - JavaScript for interactivity, inline
<script>blocks or a<script src>reference to an external file. - Flexie Scripting for data. Every function and filter listed in the Flexie Scripting reference is available inside the template.
A minimal example:
<style>
  .card { padding: 1rem; border: 1px solid #eee; border-radius: 8px;
          background: #fff; margin-bottom: .75rem; }
  .num  { font-size: 2rem; font-weight: 600; color: #1a73e8; }
  .lbl  { font-size: .85rem; color: #555; text-transform: uppercase; }
</style>

<h2>This week at a glance</h2>

<div class="card">
  <div class="num">{{ findCount("deal", "is_won", 1) }}</div>
  <div class="lbl">Deals won (all-time)</div>
</div>

<div class="card">
  <div class="num">{{ findCount("case", "status", "open") }}</div>
  <div class="lbl">Open cases</div>
</div>
Open the report and you get two KPI cards backed by live data. The same idea scales up to a full custom page.
Pull data, then weave it together
Because Flexie Scripting is available inside the template, you can run multiple lookups and combine them however you like:
{% set winners = query("
  SELECT u.full_name, SUM(d.amount) AS total
  FROM deals d
  JOIN users u ON u.id = d.owner_id
  WHERE d.is_won = 1
  GROUP BY u.id
  ORDER BY total DESC
  LIMIT 10
") %}

<h2>Top closers</h2>
<ol>
  {% for row in winners %}
    <li>
      <strong>{{ row.full_name }}</strong> —
      {{ row.total | number_format(0) }}
    </li>
  {% endfor %}
</ol>
Or fetch a list of records and render them as cards, a table, a kanban: your choice.
Loops, conditions, formatting
Everything you would expect from Flexie Scripting basics works:
{% set deals = query("
  SELECT id, name, amount, is_won, is_lost
  FROM deals
  WHERE owner_id = {user_id}
  ORDER BY date_modified DESC
  LIMIT 50
") %}

<table>
  <thead><tr><th>Deal</th><th>Amount</th><th>Status</th></tr></thead>
  <tbody>
    {% for d in deals %}
      {% set status = d.is_won ? "Won" : (d.is_lost ? "Lost" : "Open") %}
      {% set colour = d.is_won ? "#0a8a3f" : (d.is_lost ? "#c32c2c" : "#888") %}
      <tr>
        <td>{{ d.name }}</td>
        <td>{{ d.amount | number_format(2) }}</td>
        <td style="color: {{ colour }}">{{ status }}</td>
      </tr>
    {% endfor %}
  </tbody>
</table>
The same placeholder variables that work in data grid queries ({user_id}, {group_id}, {role_id}, {timezone}) work inside query(...) calls within HTML reports.
What the template can use
The full Flexie Scripting toolkit is available in HTML reports:
- Data lookups:
findOne,findMany,findCount,findSum,findMin,findMax,findDeals,findCases,findDealsValue,getSmartListRecords,getAccountContacts,getUserById,getOrganization,query(read-only SQL). - Statistics bundles:
getDealStats,getInvoiceStats,getCaseStats. - Maths and formatting:
add,subtract,multiply,divide,numberFormat,formatCurrency,round. - Dates:
date,now,dateAdd,dateSubtract,dateDiff,daysBetween. - Text:
truncate,htmlToText,startsWith,endsWith,urlEncode,md5,base64encode. - Collections:
sumField,avgField,minField,maxField,countDistinct,collectionColumn, and thegroup_by/sort_by/unique_by/sum_byfilters. - JSON:
jsonDecode,jsonPath. - Visual:
qrCode.
In short, everything a normal Flexie Scripting context can do is available, including the security helpers (signUrl, jwtEncode, hashHmac) for embedded actions and links.
Restrictions still apply
HTML reports are powerful, but the underlying data lookups still play by the rules:
query(...)is read-only. It acceptsSELECTandWITH; it rejectsINSERT,UPDATE,DELETE,DROP,TRUNCATE,CREATE, andSELECT *.- 1,000-row cap on every
findMany(...),query(...), and similar data-returning function. Aggregate inside the call (SUM,COUNT,GROUP BY) if you need a number over a larger population. - Restricted tables (system settings, attachments metadata, mailbox or SMTP credentials) are off-limits to
query(...), the same list as for data grid reports. - Only the documented Flexie Scripting functions, filters, and tags work. See the safety sandbox.
JavaScript and CSS, what runs and where
JavaScript and CSS in your template run in the viewer's browser like any other HTML page. There is no sandboxing on the rendered output. That means:
- Scripts can call your own back-end, third-party APIs, browser APIs, scoped by normal browser/CORS rules.
- Styles can be scoped to the report (use a wrapping class) or be global to the page (use careful selectors).
- The script runs after Flexie Scripting has resolved.
{{ }}tokens are resolved server-side and the JavaScript sees the final values as literal strings or numbers.
A common pattern, emit JSON, render with JS
<div id="chart"></div>

<script>
  const data = {{ query("
    SELECT month, sales
    FROM monthly_sales
    WHERE year = 2026
    ORDER BY month
  ") | json_encode | raw }};

  data.forEach(row => {
    const bar = document.createElement("div");
    bar.style.width = row.sales / 1000 + "px";
    bar.textContent = row.month + ": " + row.sales;
    document.getElementById("chart").appendChild(bar);
  });
</script>
The | json_encode | raw chain turns the query result into a JSON literal embedded straight in the script.
Use
| json_encodewhenever you embed a value inside a<script>tag. It quotes and escapes the data so a stray quote or newline in the data can't break your JavaScript or open an injection.
Filters in HTML reports
Filters can still be defined on an HTML report, using the same JSON shape covered in Report filters (in depth). Their submitted values land in the user's session, and your template reads them however you like.
In practice, HTML reports often use Flexie Scripting tokens directly inside their query(...) calls (via the same placeholders, {user_id}, {group_id}) rather than the {filters} substitution that data grid reports use. The richer rendering means you can also read filter values from the URL query string with getQueryString("name").
Security, what to keep in mind
Anyone who can edit an HTML report can place arbitrary HTML, CSS, and JavaScript in the rendered page. Anyone who can view the report runs that code in their browser. So:
- Only give "edit reports" rights to trusted users. A malicious or careless template can pull credentials from the viewer's browser, redirect them, or exfiltrate data. The permissions model controls this; keep the Edit permission tight.
- Treat data interpolated into
<script>blocks carefully. Always pass it through| json_encode(and then| rawso the resulting JSON isn't re-escaped). For data inserted as visible HTML, prefer leaving the default escaping on ({{ value }}is already escaped); only use| rawwhen you truly mean "this is HTML". - Treat data interpolated into
href/srccarefully. Use| url_encodefor query-string values.
Next steps
- Viewing, exporting & access: the view page and permissions.
- Reports as dashboard widgets: how an HTML report becomes a fully custom widget.
- Flexie Scripting reference: the toolbox your HTML template can use.